Оновлення за вересень-жовтень 2026
Що нового?
Останні кілька тижнів ми працювали над тим, щоб зробити мапу зручнішою, інформативнішою та приємнішою візуально. Ми провели загальний редизайн мапи й інтерфейсу, а також додали багато нових можливостей. Основне нововведення цього оновлення: відображення цілей у реальному часі з офіційної мапи тривог. Крім цього, з’явилися детальна мапа з містами та селами, нові теми для iPhone та Android, календар тривог, оновлена статистика та інші покращення. Розповідаємо про все детальніше.
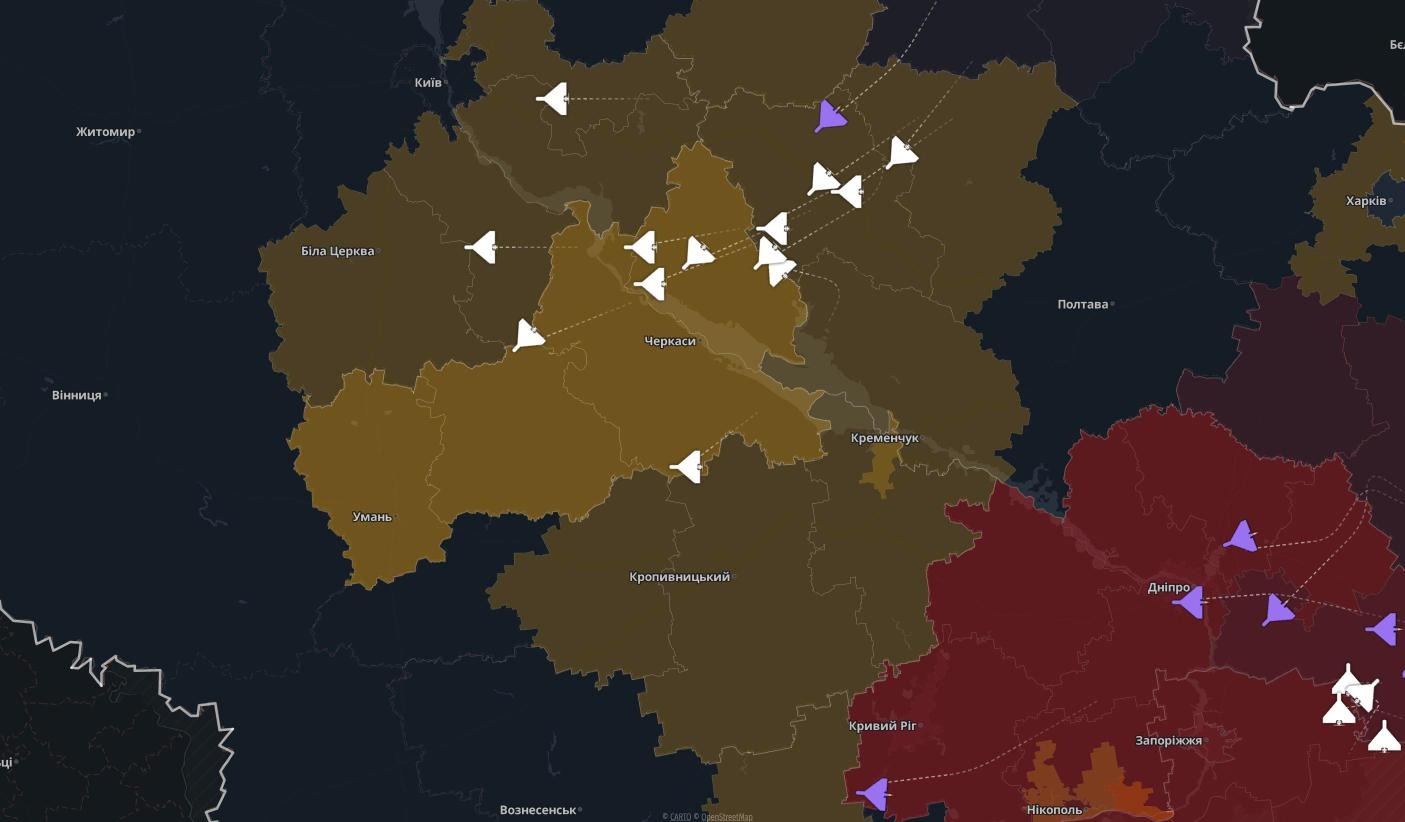
Відображення повітряних загроз
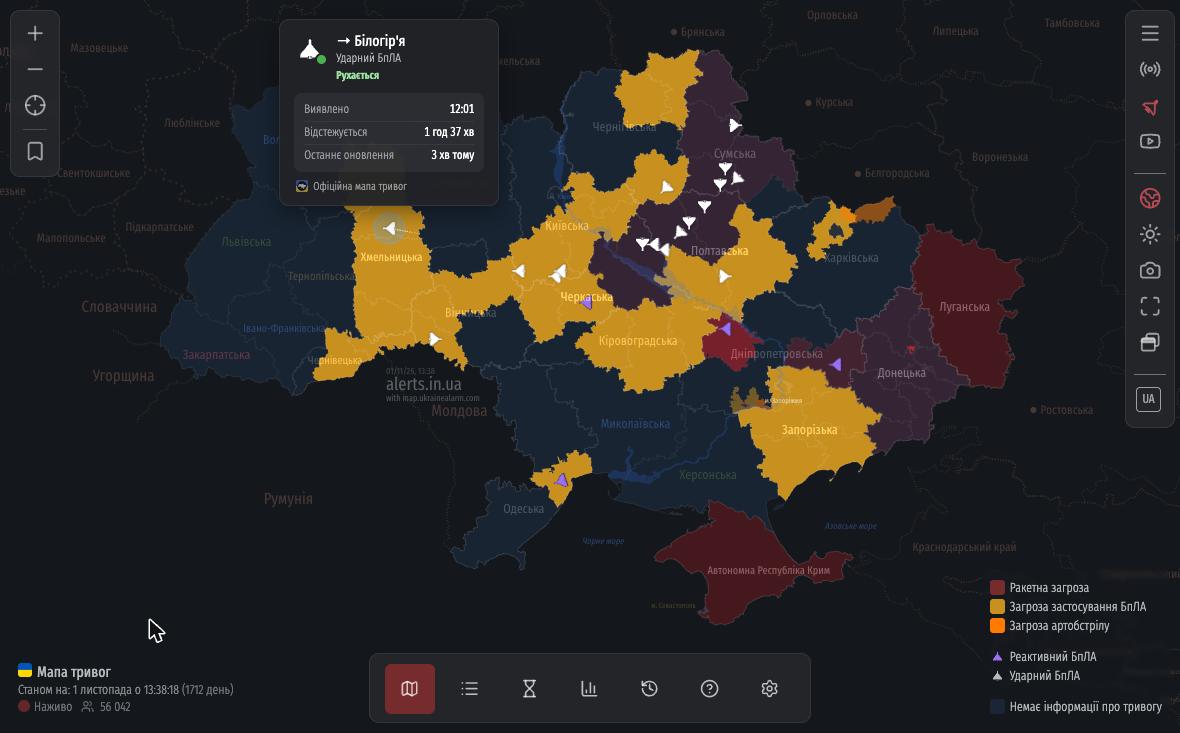 Тепер ви можете бачити ворожі цілі прямо на мапі. Дані підтягуються з офіційної мапи тривог. Шахеди, реактивні БпЛА, ракети, КАБи та розвідувальні дрони (Орлани, Мохаджери, Ланцети, Supercam, ZALA тощо) мають власні іконки. Якщо тип цілі невідомий, вона позначається знаком «?».
Якщо клікнути на ціль, ви побачите її маршрут та картку з деталями.
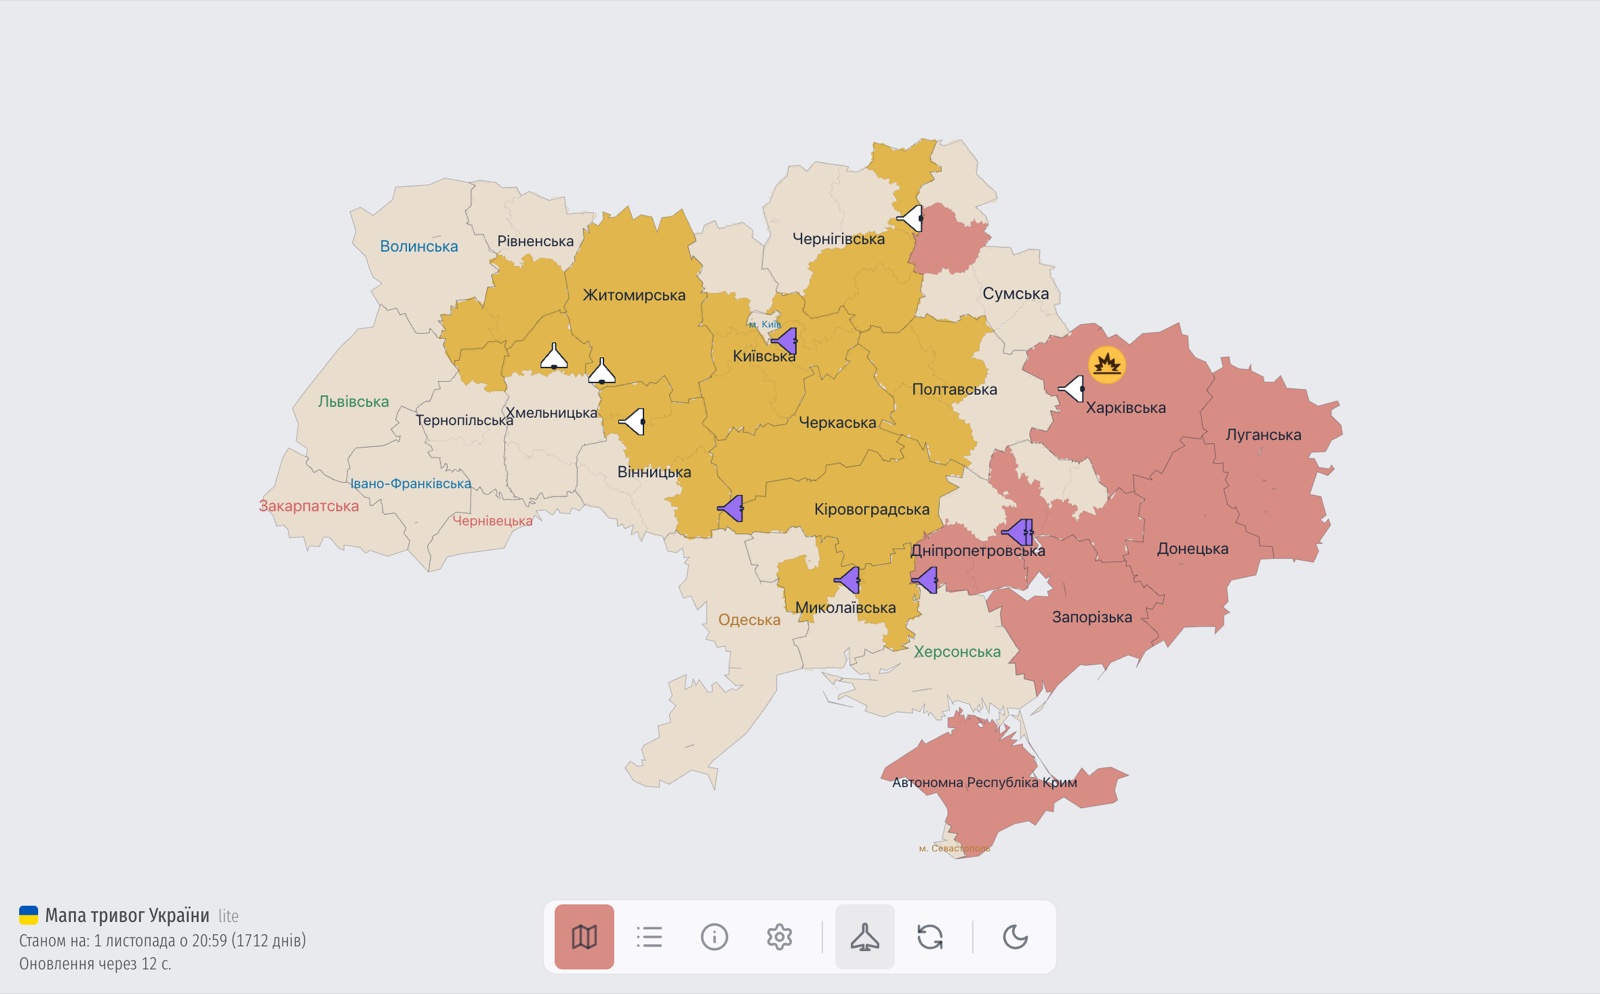 Також навіть лайт-версія мапи навчилася відображати повітряні загрози: вони вмикаються кнопкою внизу екрана.
⚠️ З міркувань безпеки дані проходять попередню обробку, тому мапа показує лише загальну картину загроз: без точних координат і відстеження в реальному часі, можливі затримки. Система не призначена для ухвалення критично важливих рішень щодо вашої безпеки.
Повітряні загрози в панелі області
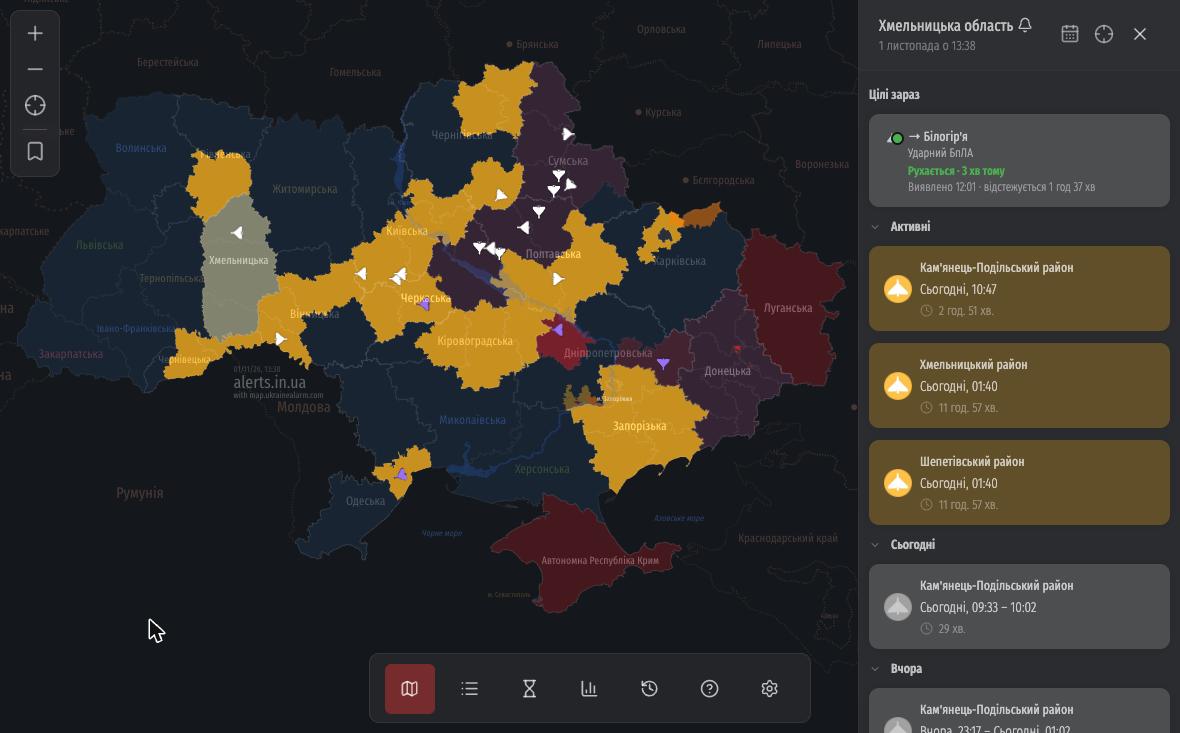 При виборі області у бічній панелі з’являється новий блок «Цілі зараз». Це список усього, що летить над регіоном у цей момент, із напрямком та часом виявлення. Клік по картці одразу перенесе вас до відповідної цілі на мапі.
Детальна мапа
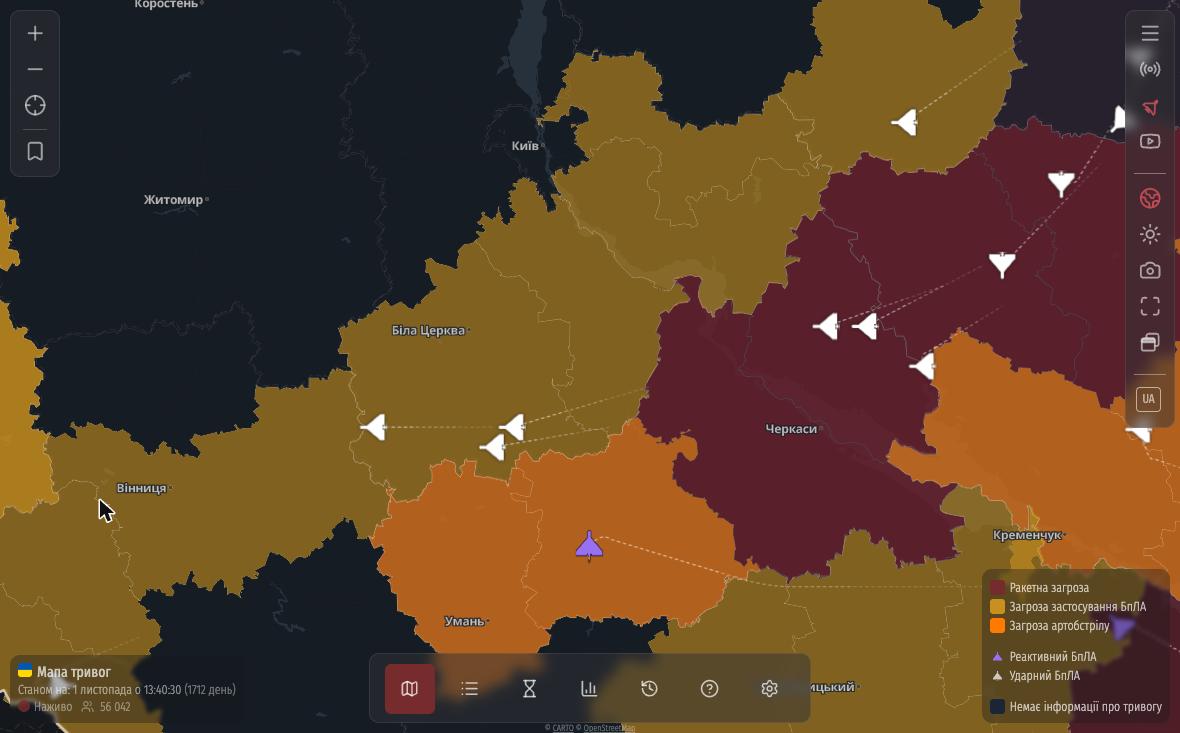 Детальна мапа замінює звичну схему областей на повноцінну карту, яку можна вільно наближати. Тривоги, як і раніше, позначені кольором, але тепер під ними видно міста й села, річки та кордони сусідніх країн.
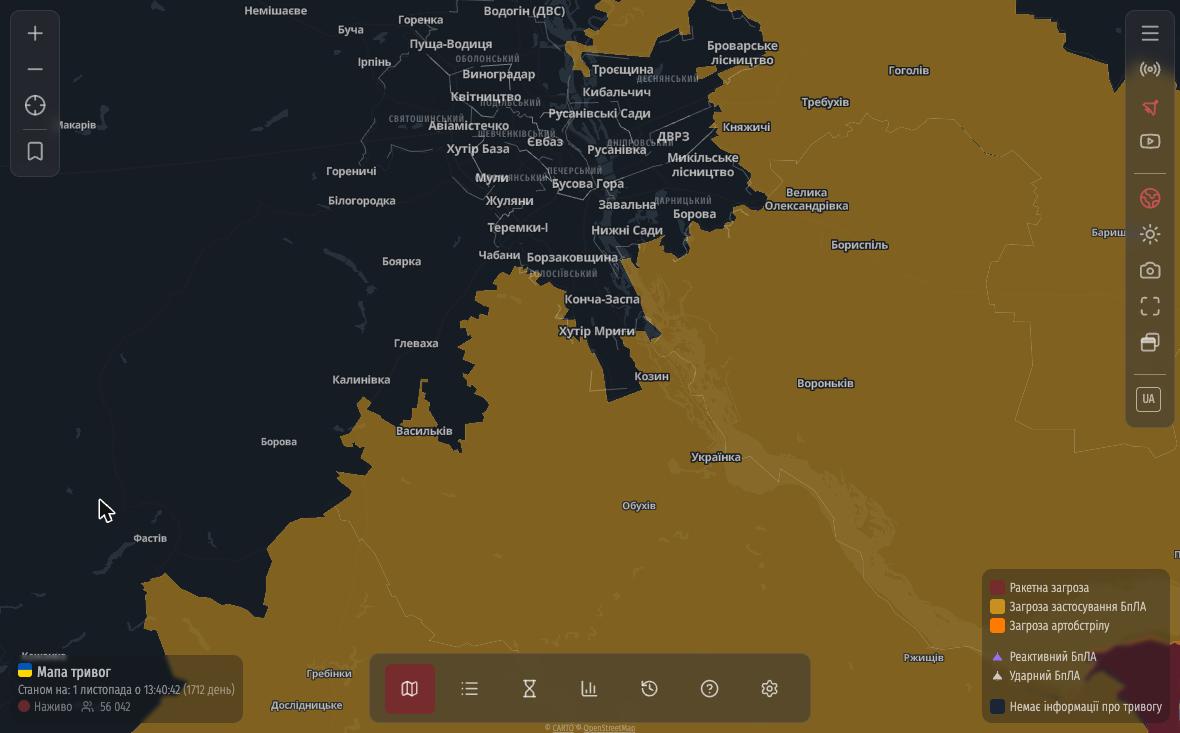 Чим ближче масштаб, тим більше деталей: у великих містах з’являються навіть назви районів і місцевостей. Також з’явилася можливість зберегти позицію на мапі, щоб під час завантаження одразу було видно, скажімо, ваше місто чи область.
На iPhone та комп’ютерах детальна мапа працює за замовчуванням. На Android ми залишили просту мапу базовою для кращої швидкодії, але детальну можна увімкнути вручну:
- Відкрийте «Налаштування» (шестерня в нижньому меню).
- Перейдіть на вкладку «Мапа».
- Увімкніть перемикач «Відображати весь світ».
Якщо детальна мапа не з’явилася, на цій же вкладці в блоці «Керування» увімкніть «Дозволити змінювати масштаб мапи», а потім «Детальна мапа».
Календар у панелі області
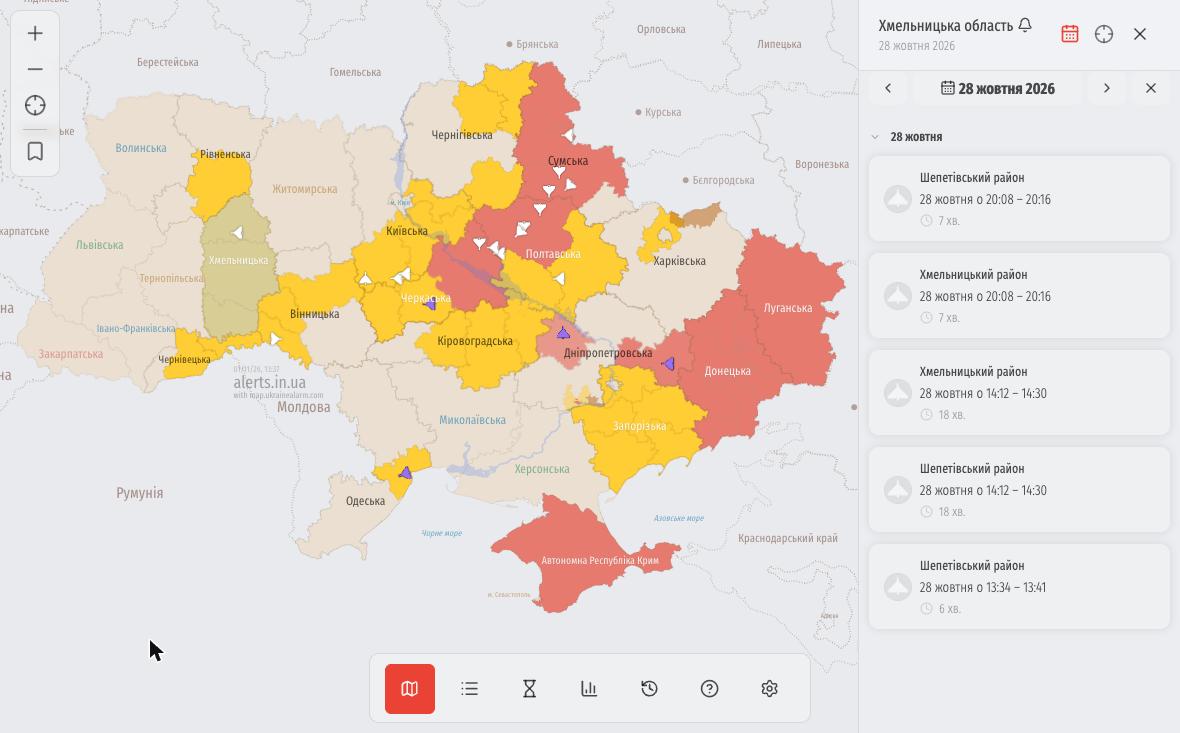
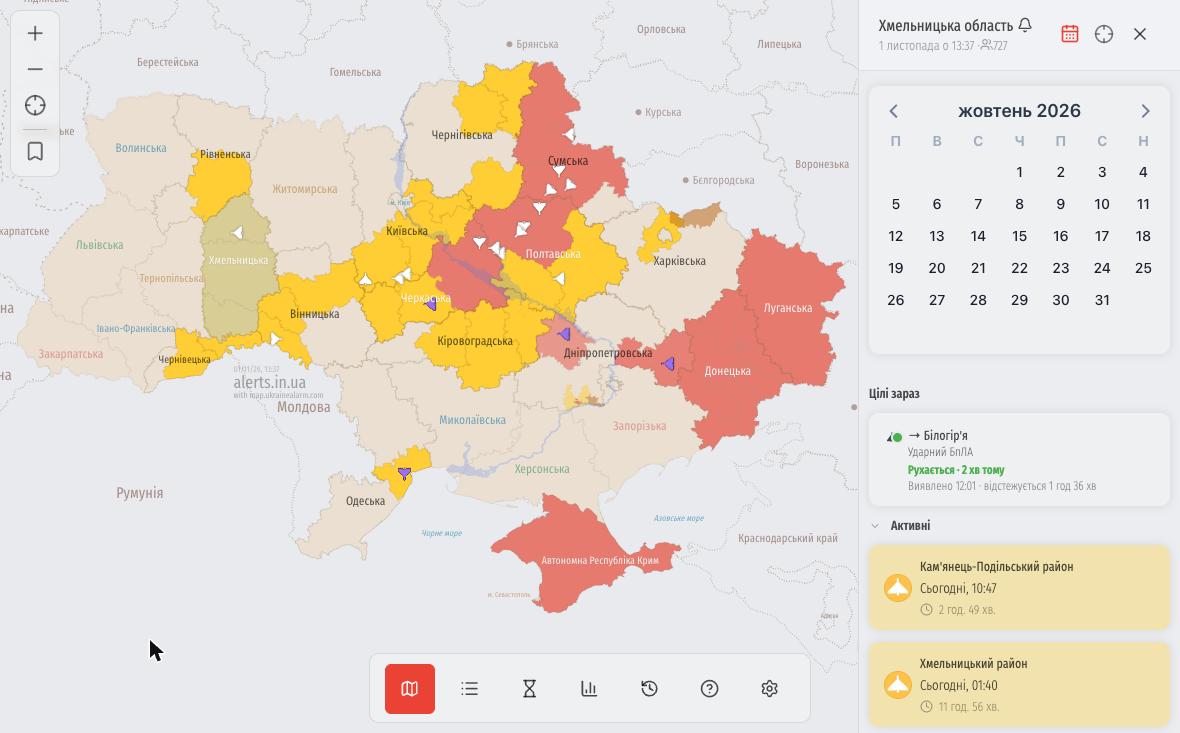 У правій панелі області з’явилася іконка календаря. Оберіть будь-яку дату, щоб побачити всі тривоги за цей день: коли вони почалися, коли закінчилися та скільки тривали. Стрілочками зручно перегортати дні вперед і назад.
Теми Liquid Glass та Material You
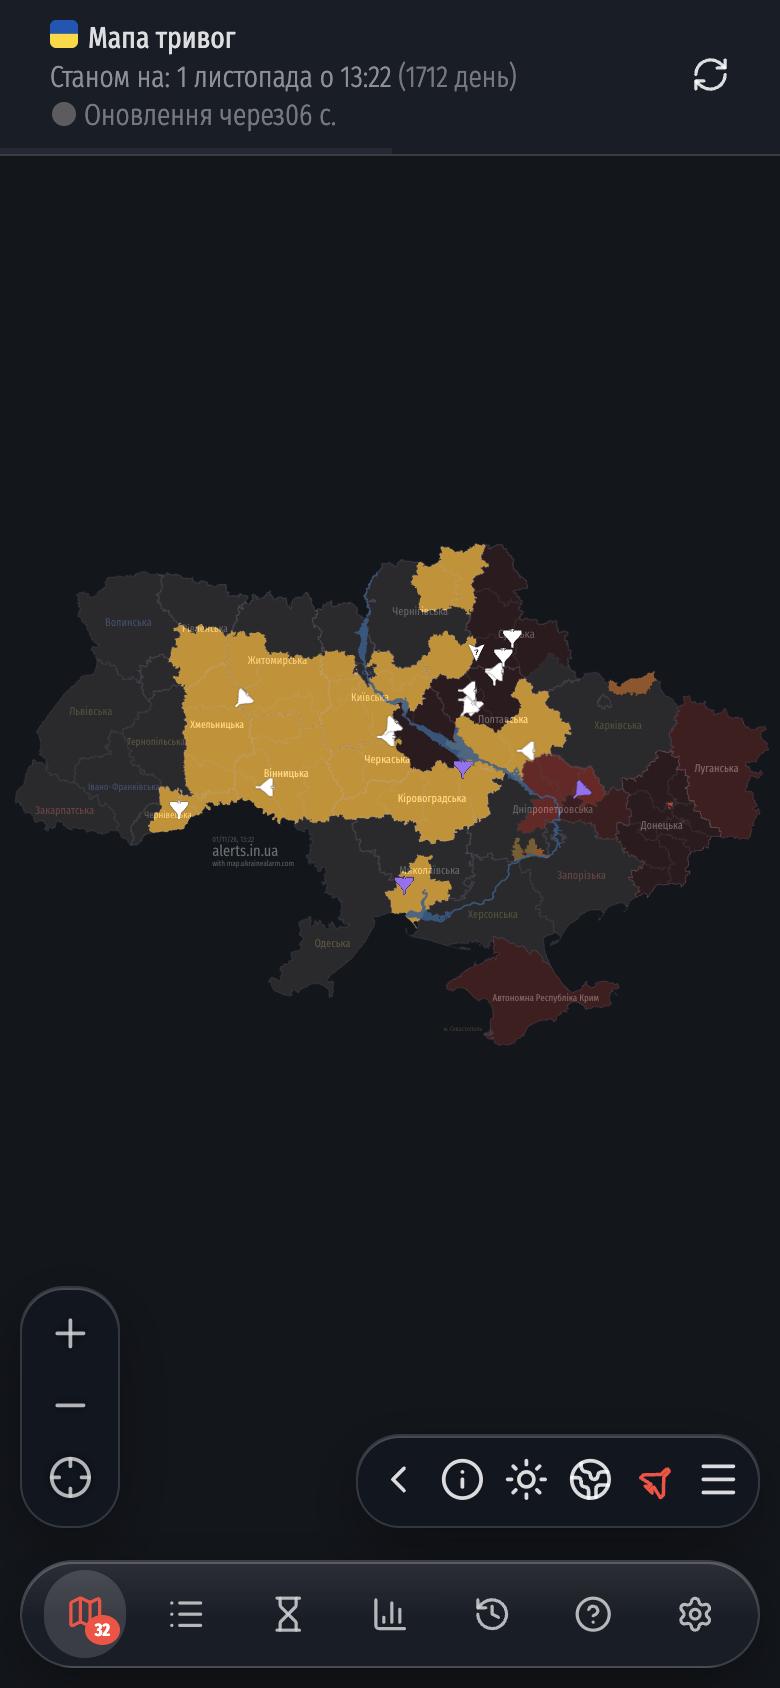
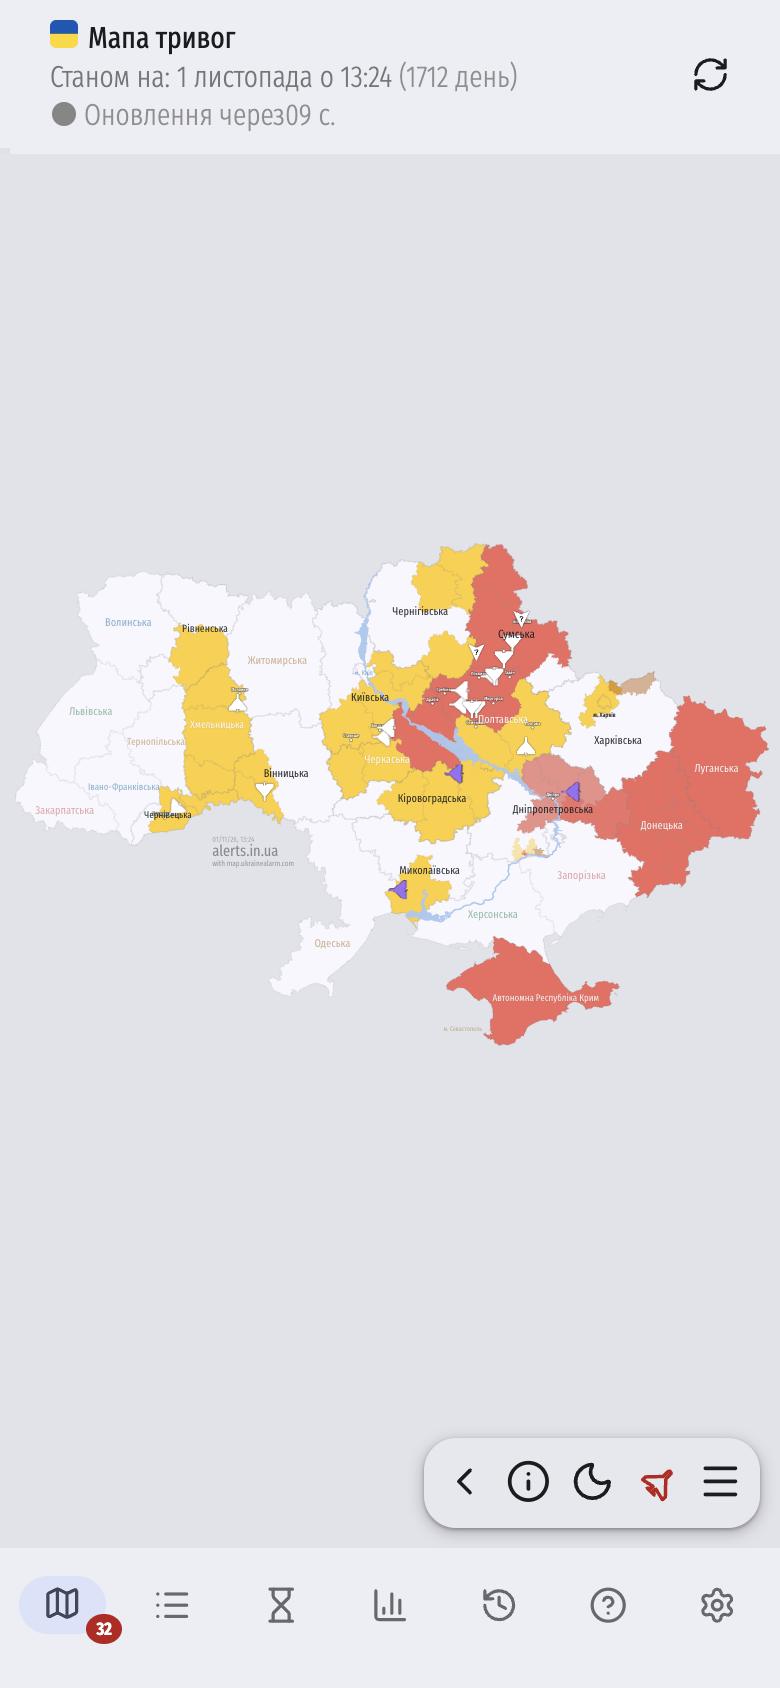
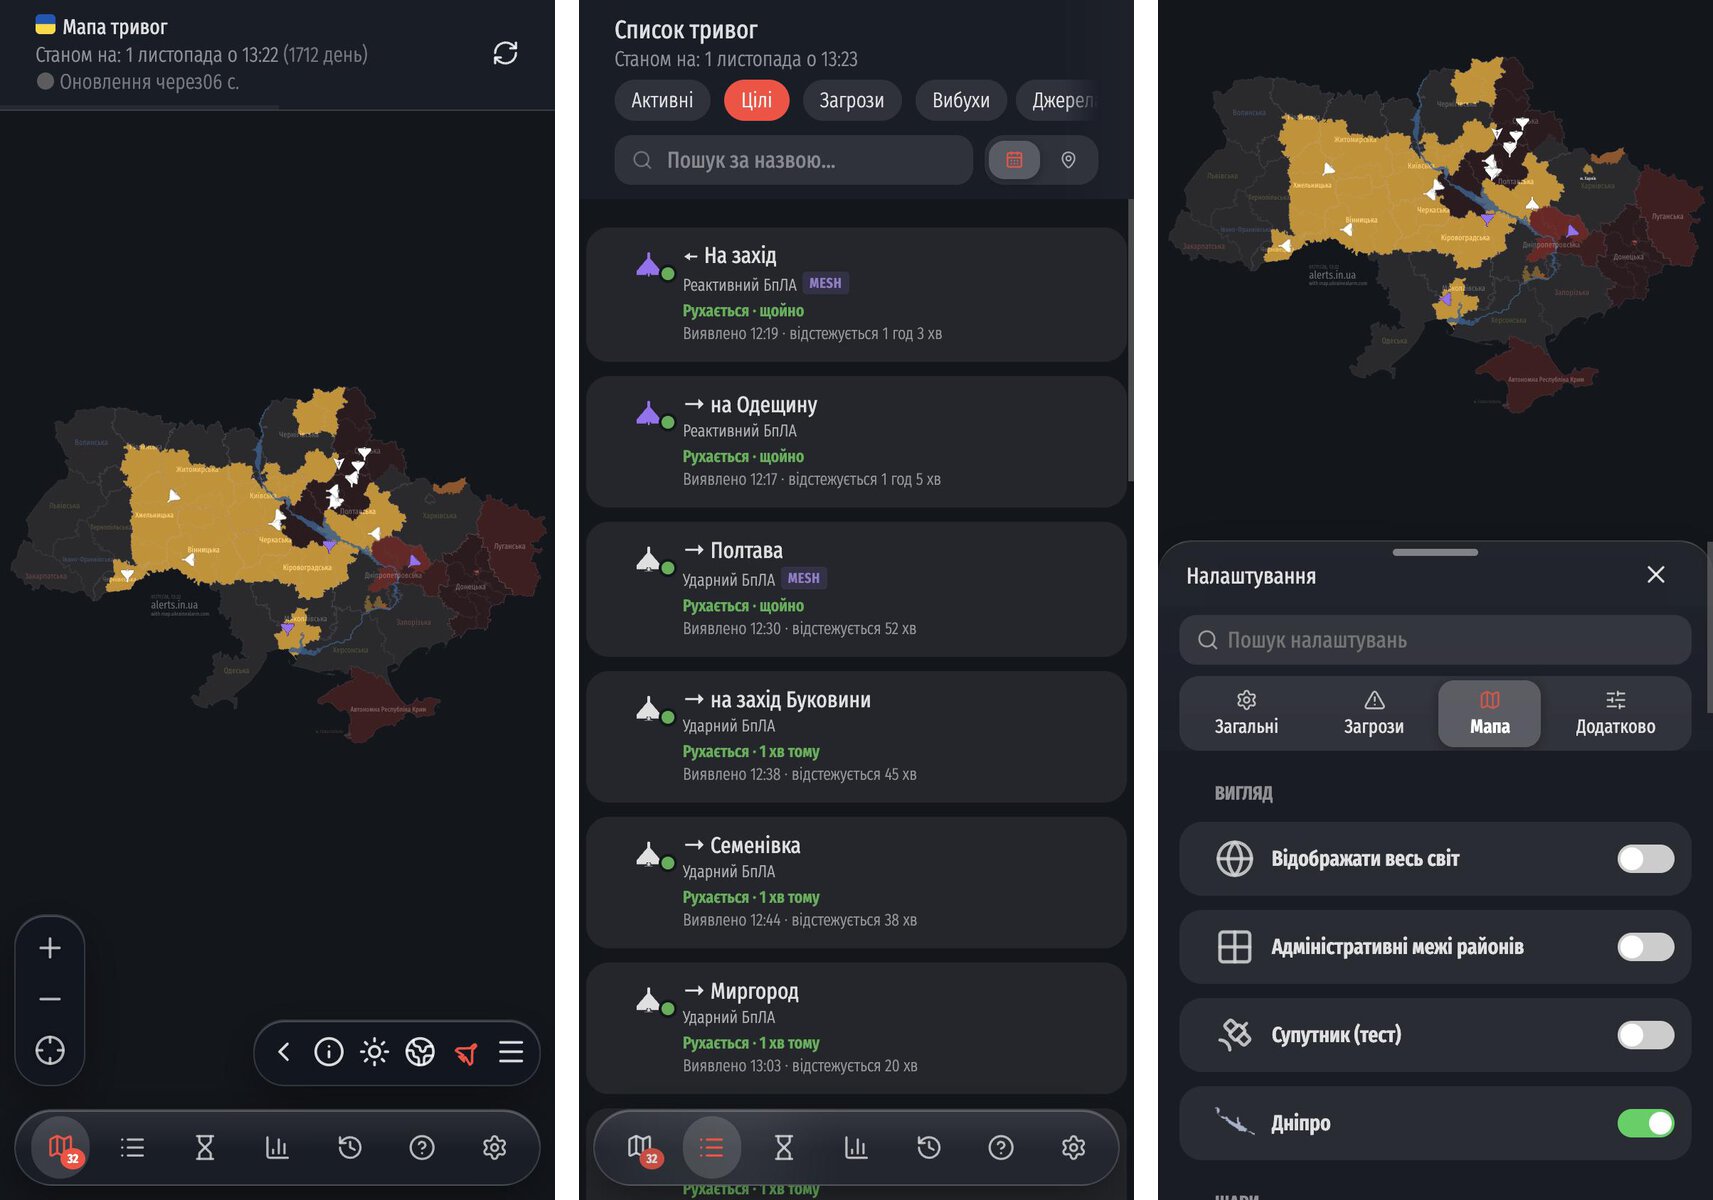
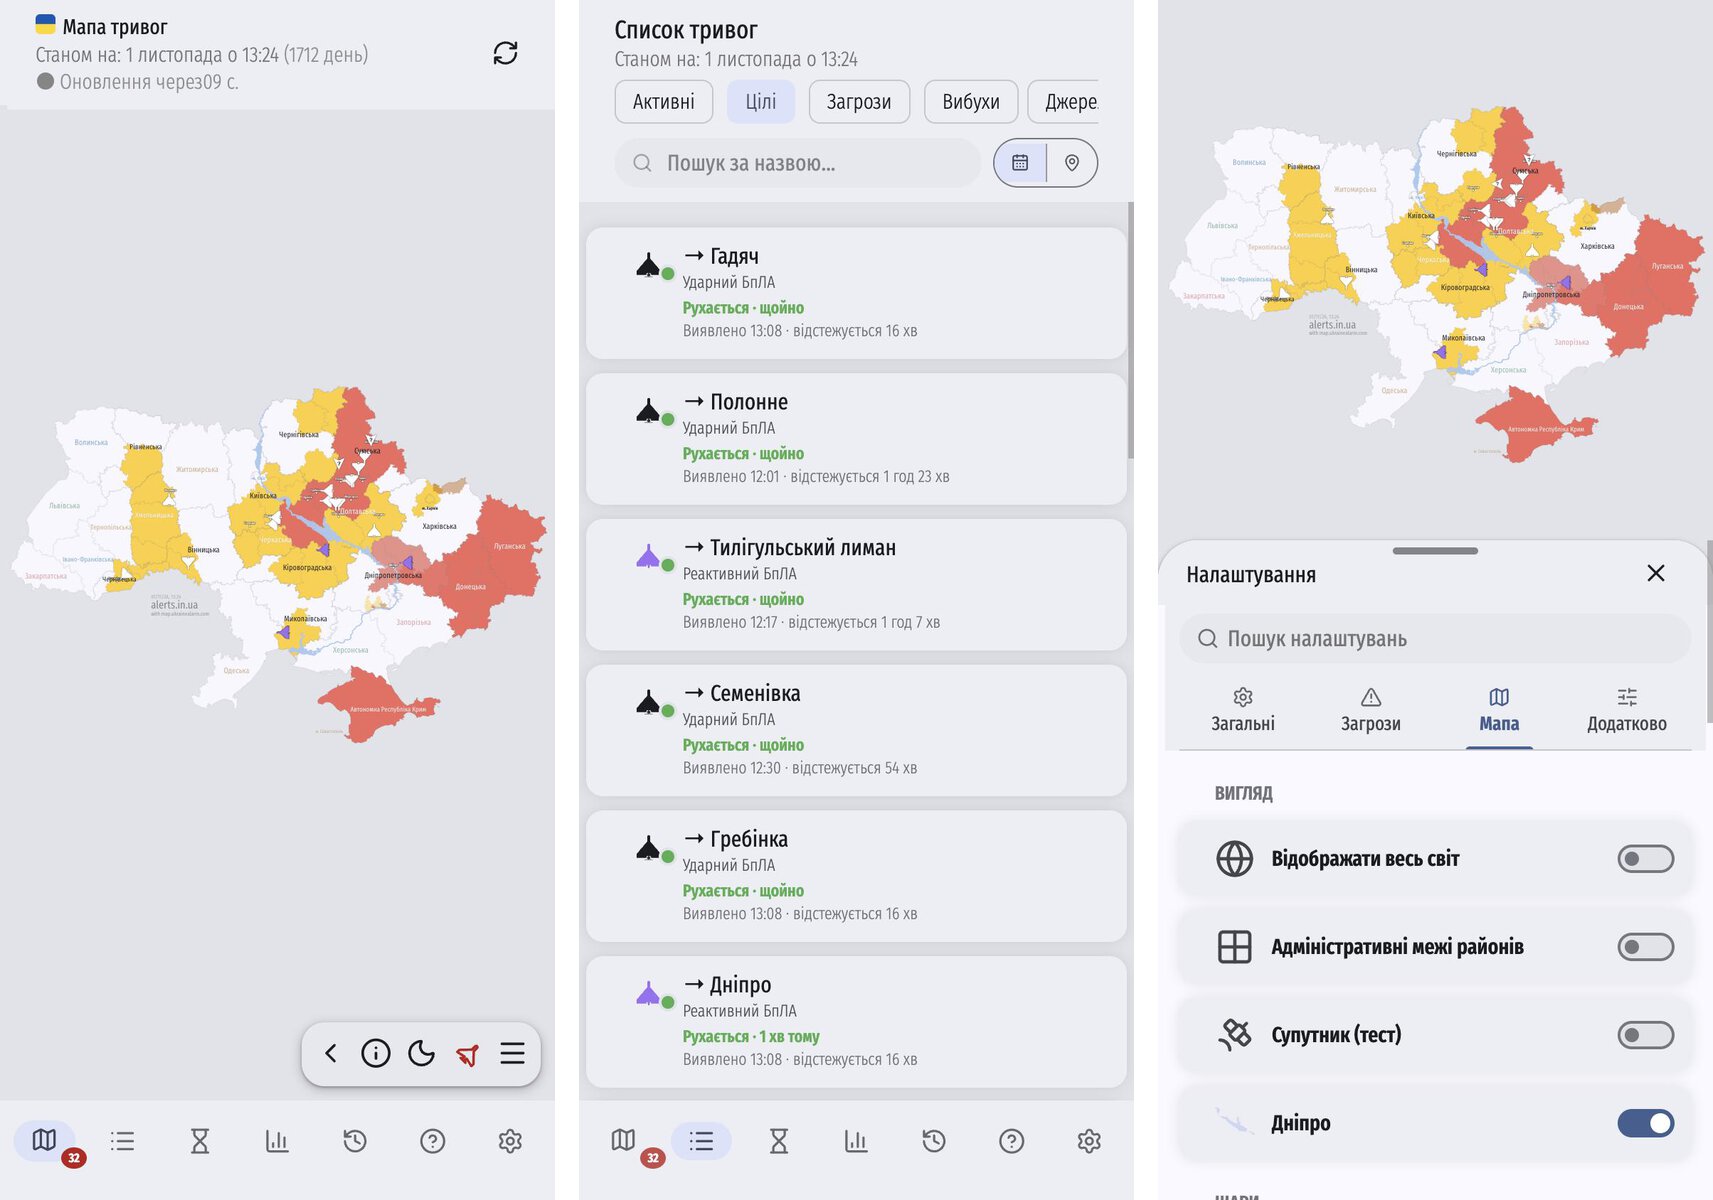
Щоб сайт виглядав на смартфонах як рідний застосунок, ми додали дві нові теми:
- Liquid Glass (для iPhone)
- Material You (для Android)
Ось як це виглядає на iPhone з Liquid Glass:
І на Android з Material You:
Тему можна вибрати в налаштуваннях: світла, темна, системна (підлаштовується під телефон) або «за часом» (темнішає вночі).
Мапа світу та тривоги в Польщі
У налаштуваннях з’явився перемикач «Відображати весь світ». Тепер при віддаленні мапи можна побачити Європу та інші країни.
Разом із цим ми додали відображення тривог у Польщі. Дані надходять із польської державної системи оповіщення Alert RCB.
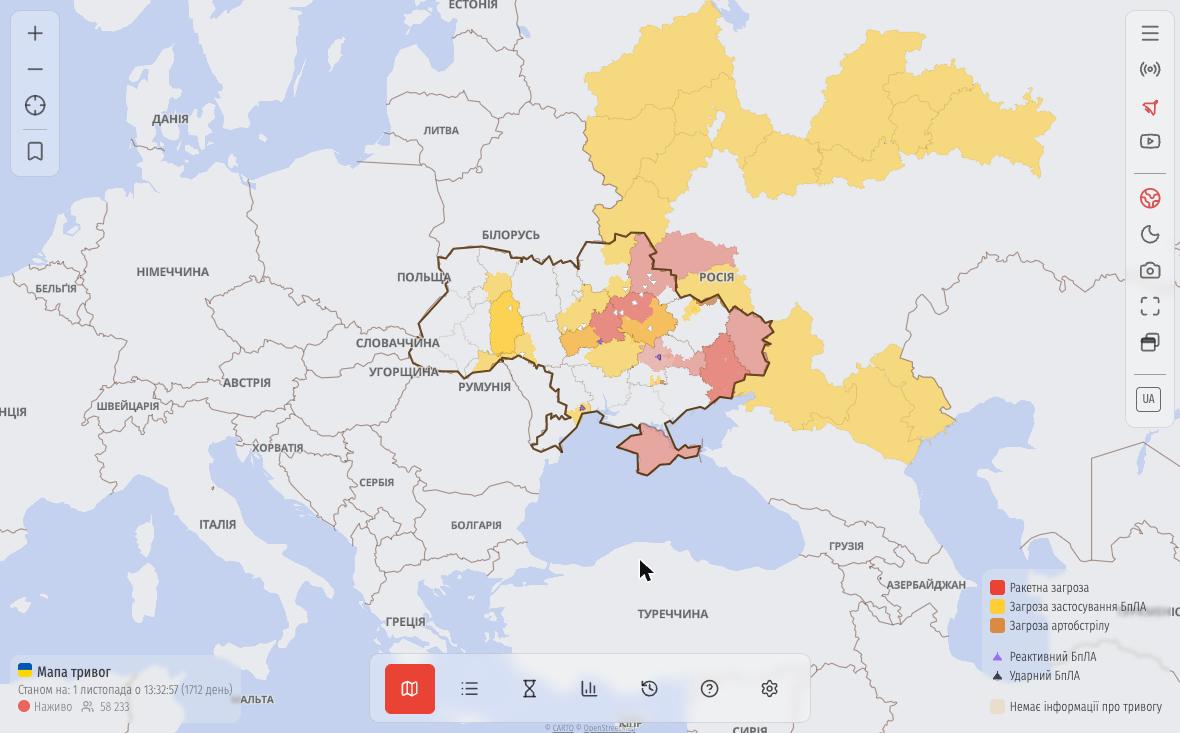
Нові мови: литовська, латвійська та естонська
Сайт тепер доступний литовською, латвійською та естонською мовами. Литва, Латвія та Естонія також з’явилися на мапі серед сусідніх країн, і в майбутньому ми плануємо відображати тривоги і для них.
Оновлена довідка
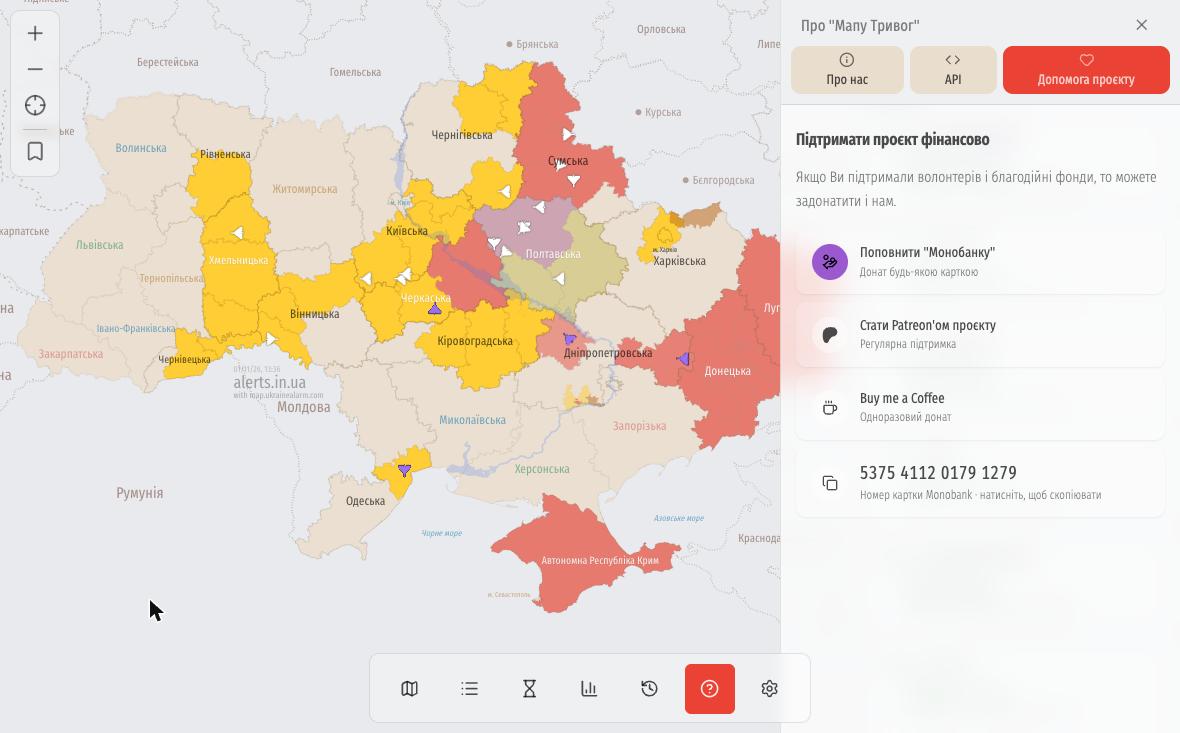 Сторінка «Про “Мапу тривог”» стала зручнішою: на великих екранах вона відкривається панеллю збоку. Тут зібрана детальна легенда (рівні тривоги, загрози, цілі), відповіді на часті запитання, генератор коду для вбудовування мапи на свій сайт (iframe) та реквізити для підтримки проєкту.
Жовтий і червоний рівні в історії
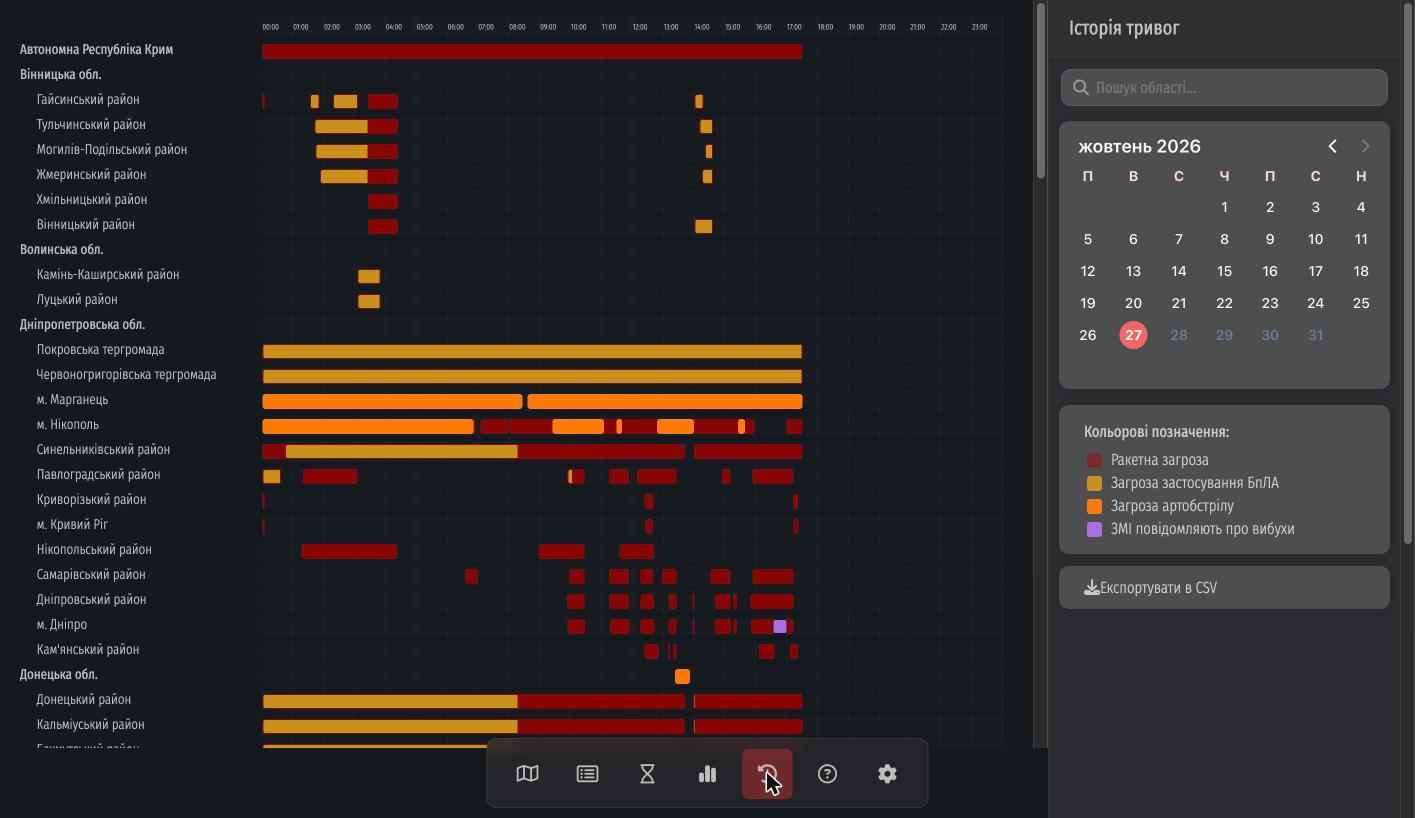 Рівні тривоги (жовтий і червоний) тепер видно не лише на мапі, а й в історії. На графіку добре видно, коли тривога була жовтою (наприклад, через загрозу БпЛА), а коли переходила в червону. Повідомлення на кшталт «ЗМІ повідомляють про вибухи» виділяються фіолетовим кольором.
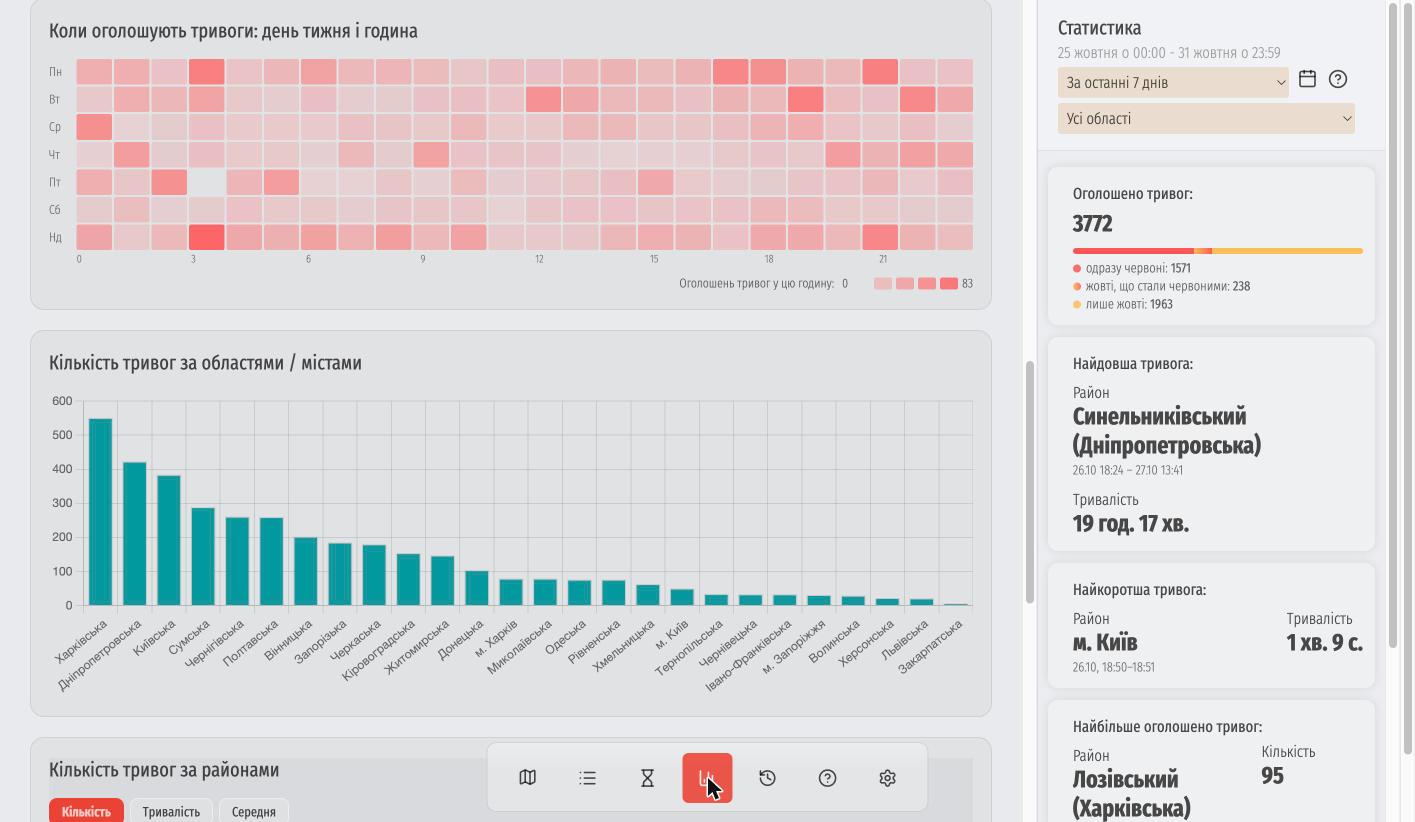
Повністю нова статистика
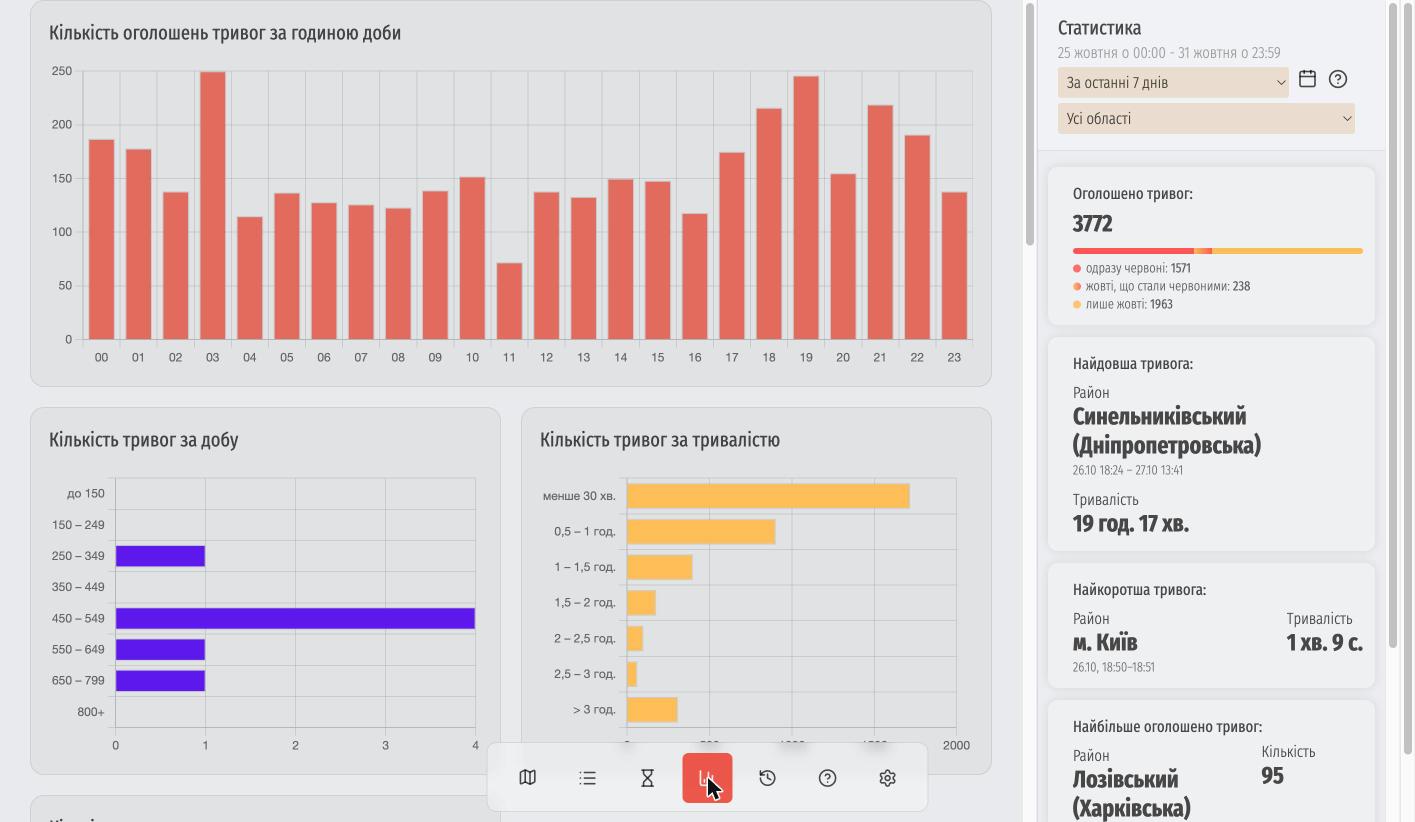 Ми з нуля переробили розділ статистики. Тепер можна вибрати будь-який період (сьогодні, вчора, тиждень або конкретний день у календарі) та область.
Що всередині:
- Розбивка тривог за рівнями (одразу червоні, жовті, що стали червоними, і лише жовті).
- Графіки за годинами, днями тижня та тривалістю.
- Теплова карта, яка наочно показує, в які дні та години найчастіше лунають сирени.
- Рейтинги областей, міст і районів (де найдовші, найкоротші та найчастіші тривоги).
- Статистика по районах з початку 2026 року.
На широких екранах підсумок зручно виводиться збоку.
Екран «Тривалості»
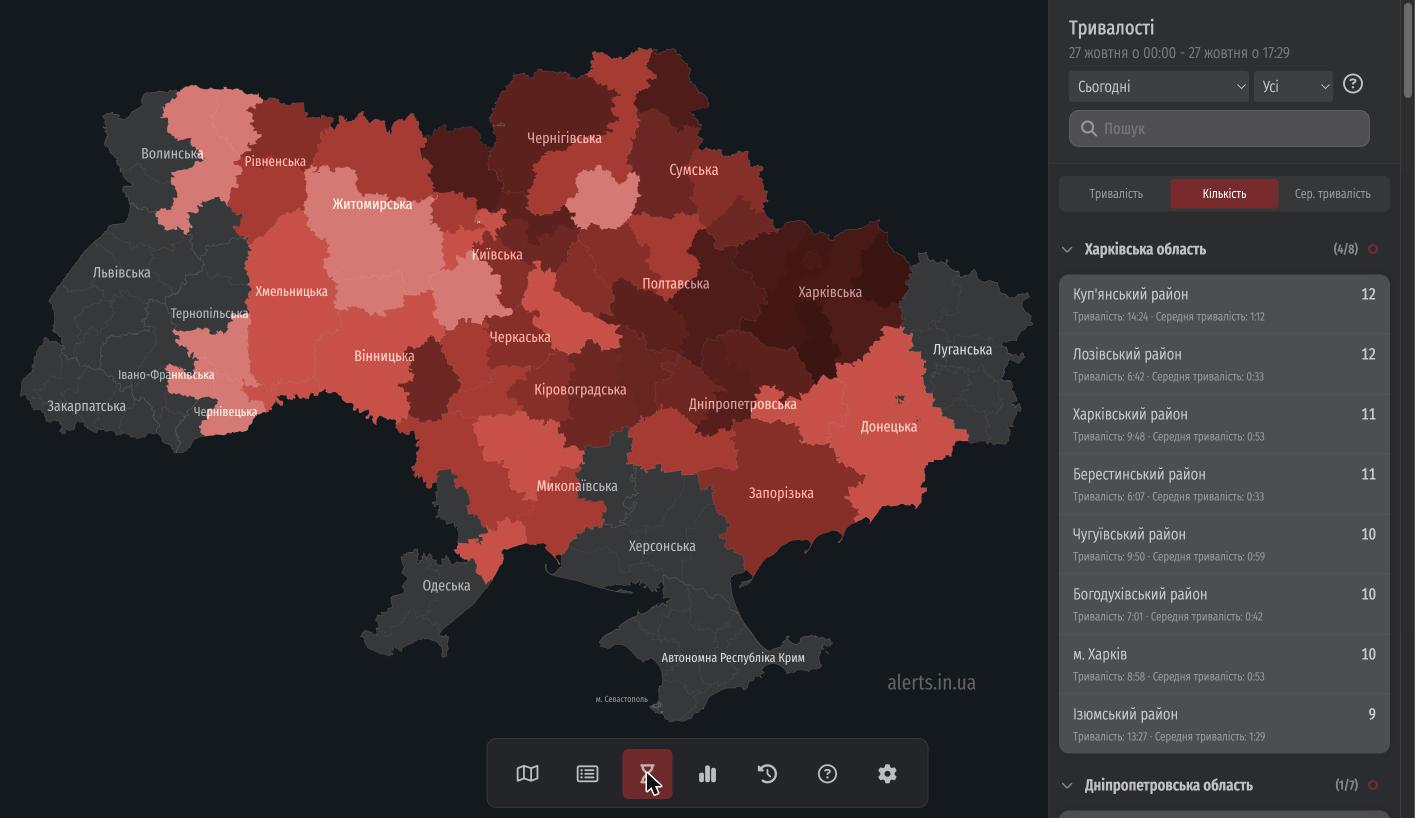 Тут також є корисні зміни:
- З’явився фільтр за рівнем тривоги («Усі / Червоні / Жовті»).
- Можна перемикати сортування: за тривалістю, кількістю або середнім часом.
- Райони згруповані за областями (групи можна згортати), працює пошук.
- Харків та Запоріжжя винесені окремими рядками.
- Тривоги, що накладаються одна на одну, більше не дублюються в підрахунках.
Список тривог
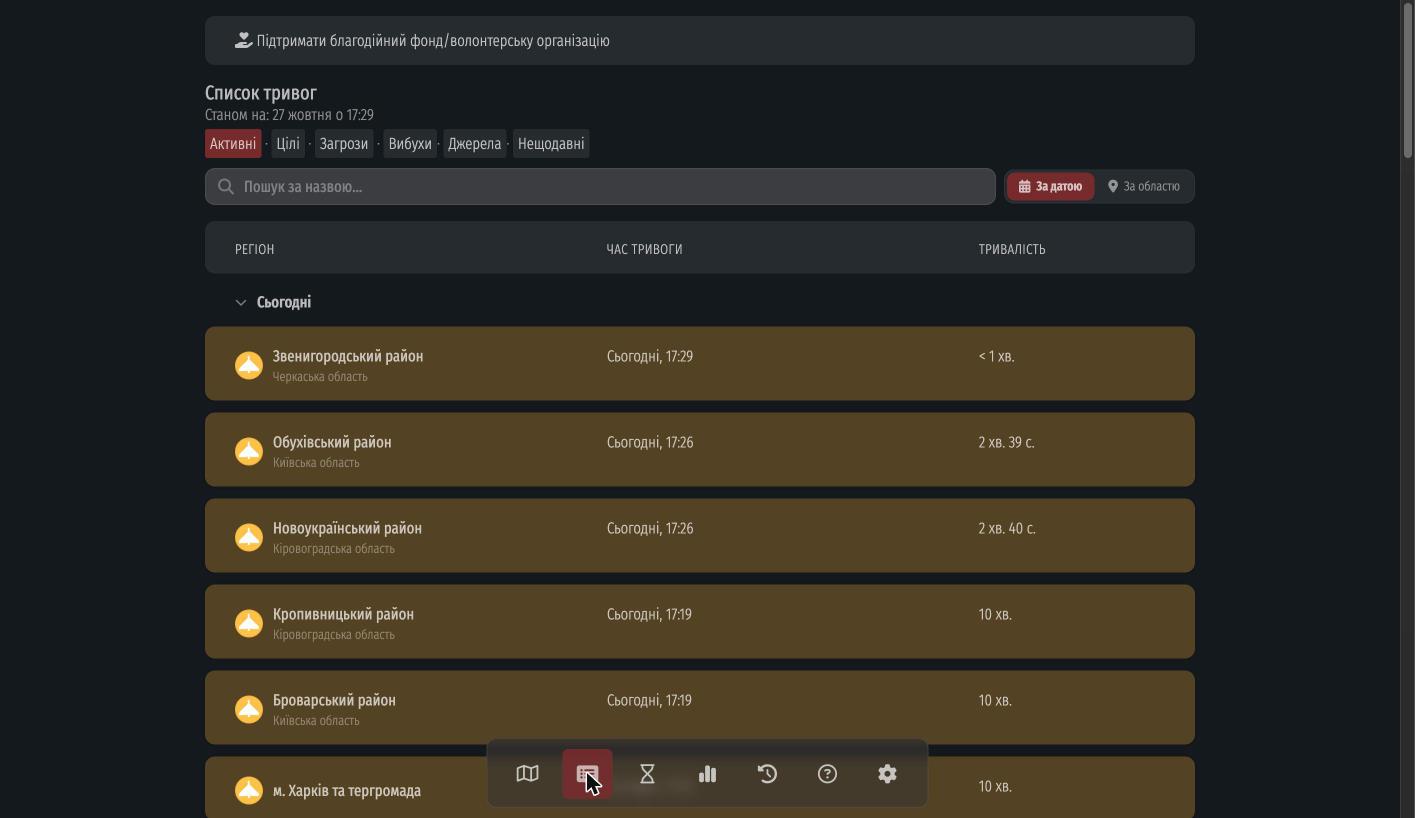 У списку тривог з’явився пошук за назвою та зручне групування («За датою» або «За областю»). Якщо ви помітили, що якоїсь тривоги не вистачає, прямо зі списку можна повідомити нам про це.
Перероблені налаштування
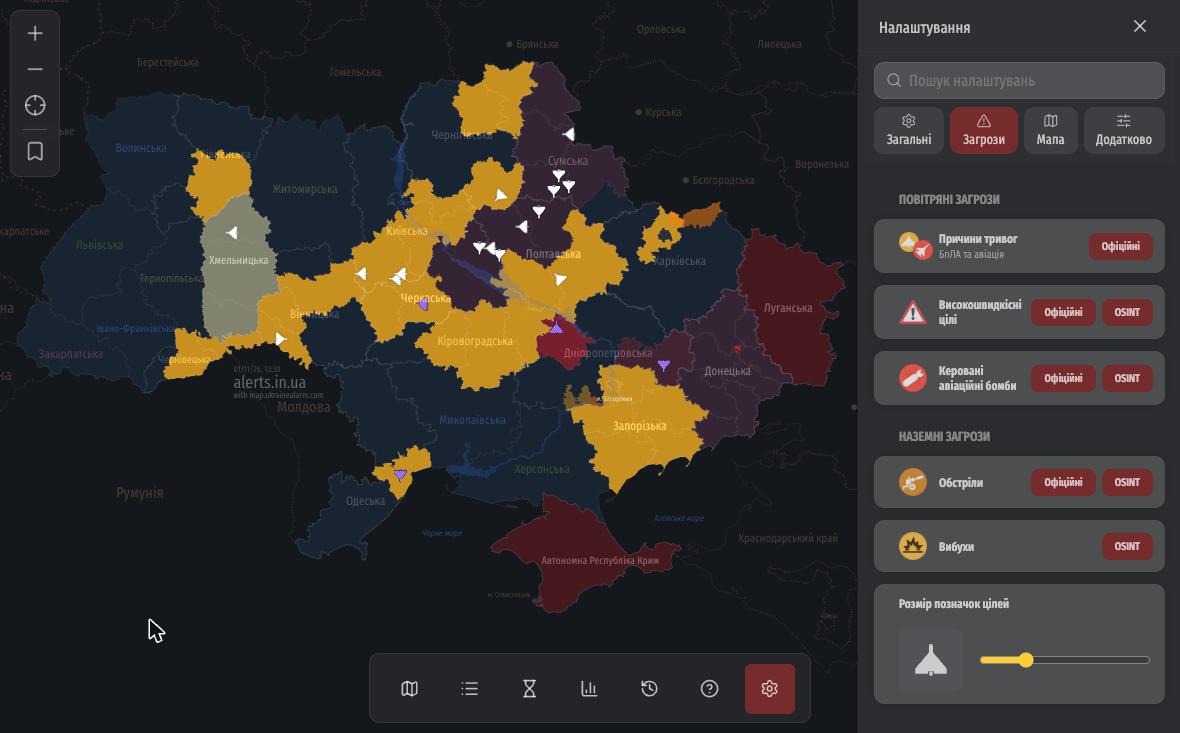
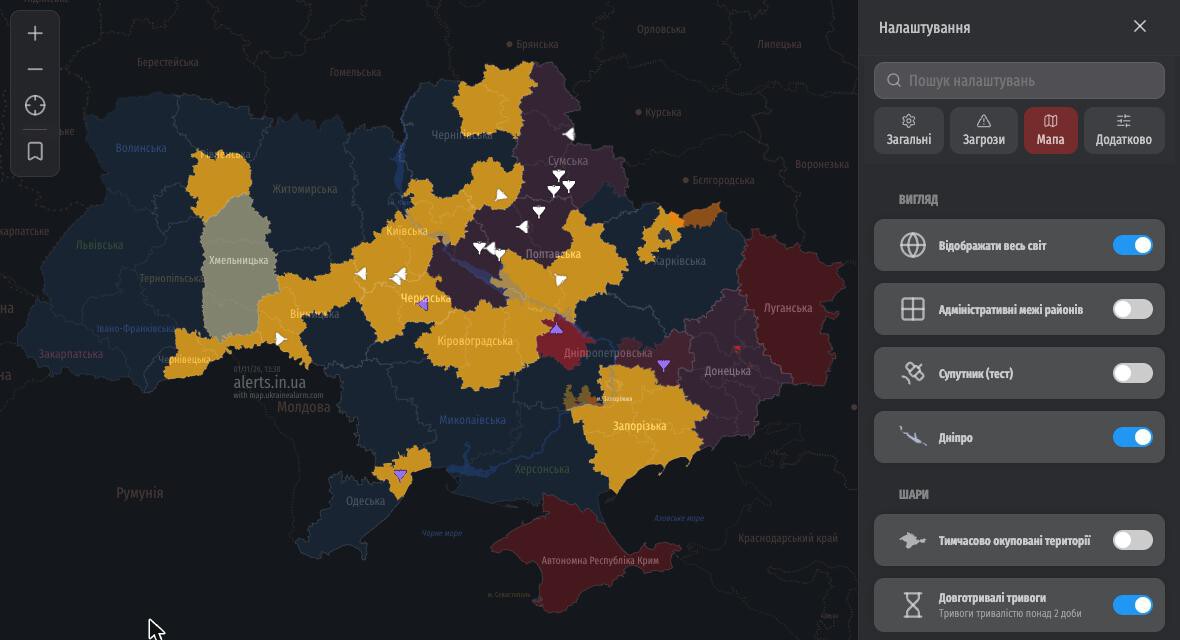 Налаштування стали охайнішими. Ми розбили їх на чотири вкладки («Загальні», «Загрози», «Мапа», «Додатково»), додали іконки та пошук. Сайт запам’ятовує, на якій вкладці ви зупинилися.
Що нового в налаштуваннях:
- Можна повернути старий вигляд мапи без жовтого рівня, увімкнувши «Відображати всі повітряні тривоги червоним».
- У вкладці «Загрози» можна окремо обрати джерело даних для кожного типу загрози (офіційні чи моніторингові канали), а нижче переглянути перелік усіх джерел.
Що ще цікавого?
- Новий шрифт і «плаваюча» панель вкладок на великих екранах.
- Режим для правої руки: кнопки масштабування праворуч, панель іконок ліворуч.
- Тривоги в РФ позначаються крапкою біля назви регіону, а всі регіони стали клікабельними.
- Під час балістичної загрози на місто додається позначка «підвищена небезпека».
- Режим «Картинка в картинці» (PiP) тепер показує цілі та рівні тривоги.
- Іконка вкладки в браузері відображає кольори областей відповідно до рівня тривоги.
- У push-сповіщеннях із підсумками доби з’явилися жовті та червоні рівні.
- Балістична загроза прив’язується до конкретних районів із червоною тривогою, а не до всієї області.
- Підказки на мапі показують джерело повідомлення та час («N хвилин тому»).
- Оновили іконки по всьому сайту (перейшли на Lucide).
- На iPad в альбомній орієнтації список тривог відкривається поруч із мапою.
- Покращили те, як ШІ розпізнає тексти з моніторингових каналів.
- Спростили геометрію мапи для всіх пристроїв, тож вона завантажується і працює швидше.
- У налаштуваннях з’явився тестовий режим «Супутник (тест)» із супутниковими знімками.
Що далі?
Зараз ми найбільше зосереджені на швидкодії. Смартфонів на Android дуже багато, і мапа може працювати на них по-різному: на одних швидко, на інших дещо повільніше. Тому найближчим часом займаємося оптимізацією, щоб усе працювало плавно на будь-якому пристрої.
Загалом ми не женемося за кількістю інформації на мапі. Для нас набагато важливіша її якість та достовірність.
Якщо ви хочете підтримати нашу роботу, будемо вдячні за донат або оцінку нашого застосунку в Google Play та App Store. Дякуємо, що залишаєтеся з нами!
What’s New?
Over the past few weeks, we have been working to make the map more convenient, informative, and visually appealing. We carried out an overall redesign of the map and interface and added many new features. The main highlight of this update is displaying real-time targets from the Official Air Raid Alert Map. In addition, we added a detailed map with cities and villages, new native-like themes for iPhone and Android, an alert calendar, redesigned statistics, and other improvements. Here is a closer look at everything.
Displaying Air Threats
You can now see enemy targets directly on the map, powered by data from the Official Air Raid Alert Map. Shaheds, jet-powered UAVs, missiles, guided aerial bombs (KABs), and reconnaissance drones (Orlan, Mohajer, Lancet, Supercam, ZALA, etc.) each have their own distinct icon. Unknown target types are marked with a “?” icon.
Click on a target to view its trajectory and a detail card.
Even the lite version of the map can now display air threats: turn them on with the button at the bottom of the screen.
⚠️ For security reasons, data is pre-processed, so the map shows only the general picture of threats: no exact coordinates or real-time tracking, and delays are possible. The system is not intended for making critical safety decisions.
Air Threats in the Region Panel
When you select a region, the side panel now shows a “Current Targets” section. It lists everything currently flying over that region, along with heading and detection time. Clicking any card centres the map on that target.
Detailed Map
The detailed map replaces the familiar schematic of regions with a full map you can zoom freely. Alerts are still marked by colour, but underneath them you can now see cities and villages, rivers, and neighboring country borders.
The closer you zoom, the more detail appears: in large cities you can even see the names of districts and neighbourhoods. You can also now save a position on the map, so that your city or region, for example, is in view as soon as the map loads.
On iPhone and desktop, the detailed map is enabled by default. On Android, we kept the simple map as the default for better performance, but you can enable the detailed map manually:
- Open “Settings” (the gear in the bottom menu).
- Go to the “Map” tab.
- Turn on the “Show the whole world” toggle.
If the detailed map doesn’t appear, turn on “Allow map zooming” and then “Detailed map” in the “Controls” section of the same tab.
Calendar in the Region Panel
A calendar icon has been added to the right region panel. Pick any date to see all alerts for that day, including start time, end time, and duration. Use the arrows to step backward and forward through days.
Liquid Glass and Material You Themes
To make the site feel like a native app on smartphones, we added two new themes:
- Liquid Glass (for iPhone)
- Material You (for Android)
Here is how it looks on iPhone with Liquid Glass:
And on Android with Material You:
You can choose your theme in settings: Light, Dark, System (follows your device), or Scheduled (dark at night).
World Map and Alerts in Poland
Settings now feature a “Show whole world” toggle. When you zoom out, you can see Europe and neighboring countries.
Alongside this, we added air raid and emergency alerts in Poland, sourced from the Polish government warning system Alert RCB.
New Languages: Lithuanian, Latvian, and Estonian
The site is now available in Lithuanian, Latvian, and Estonian. Lithuania, Latvia, and Estonia also appear on the map among neighboring countries, and we plan to display alerts for them in the future.
Updated About Page
The “About Air Raid Alert Map” page is now easier to use and opens as a side panel on wide screens. It includes a detailed legend (alert levels, threats, targets), FAQ, an embed/link builder (iframe) for adding the map to your own website, and options for supporting the project.
Yellow and Red Alert Levels in History
Alert levels (yellow and red) are now shown not only on the map, but also in history. The “Alert History” chart clearly shows when an alert was yellow (e.g., UAV threat) and when it escalated to red. “Media reports explosions” notifications are highlighted in purple.
Redesigned Statistics
We rebuilt the statistics section from scratch. You can now select any time period (today, yesterday, this week, last 7 days, or a specific date in the calendar) and filter by region.
What’s inside:
- Breakdown of alerts by level (immediately red, yellow that escalated to red, and yellow only).
- Charts by hour of day, day of week, and duration.
- A heatmap showing which days and hours sirens sound most frequently.
- Rankings of regions, cities, and districts (longest, shortest, and most frequent alerts).
- District-level statistics since the beginning of 2026.
On wide screens, the summary is displayed alongside the charts.
Durations Screen
Useful improvements to the “Durations” screen:
- Filter by alert level (“All / Red / Yellow”).
- Switch sorting between total duration, alert count, or average duration.
- Districts are grouped by region (groups are collapsible) with search support.
- Kharkiv and Zaporizhzhia have their own dedicated rows.
- Overlapping alerts are no longer double-counted.
Alerts List
The alerts list now includes search by name and grouping (“By date” or “By region”). If you notice a missing alert, you can report it directly from the list.
Redesigned Settings
Settings are much cleaner and organized into four tabs (“General”, “Threats”, “Map”, “Advanced”), complete with icons and search. The site remembers the last tab you had open.
New in settings:
- You can switch back to the classic map look without yellow alert levels by enabling “Show all air raid alerts in red”.
- In the “Threats” tab, you can choose the data source for each threat type individually (Official or OSINT monitoring channels), and view the full list of sources below.
Other Improvements
- New primary font and a floating tab bar on wide screens.
- Right-handed mode: zoom buttons on the right, icon bar on the left.
- Alerts in Russian regions are marked with a dot next to the region name, and all regions are now clickable.
- During a ballistic threat, a “high danger” badge is added to the targeted city.
- Picture-in-Picture (PiP) mode now displays targets and yellow/red alert levels.
- The browser tab favicon reflects region colors by alert level.
- Daily summary push notifications now include yellow and red alert levels.
- Ballistic threats are now linked to specific districts with a red alert rather than the entire region.
- Map tooltips show the message source and relative time (“N minutes ago”).
- Updated icons across the entire site (switched to Lucide).
- On iPad in landscape orientation, the alerts list opens side by side with the map.
- Improved AI parsing of monitoring channel messages.
- Simplified map geometry across all devices so it loads and runs faster.
- Settings now include an experimental “Satellite (beta)” mode with satellite imagery.
What’s Next?
Right now, our main focus is performance. There is a huge variety of Android devices, and the map can perform differently across them: fast on some, slightly slower on others. In the near future, we will be focusing on optimization so that everything runs smoothly on any device.
Overall, we do not chase the sheer quantity of information on the map — its quality and reliability matter much more to us.
If you would like to support our work, we appreciate your donation or a rating for our app on Google Play and the App Store. Thank you for staying with us!